R is broad and powerful, with many analytic and graphic functions available (more than 50,000). With guidelines and instructions, you can navigate the tremendous resources available in R thereby accomplishing your work with style, elegance and efficiency.
Many people and researchers despise statistics, mainly due to non-mathematical background. This makes understanding complex statistical equations very difficult. The advent of computer programs such as R and the like provides a unique opportunity to teach statistics at a conceptual level without getting too bogged down in equations. However, the downside of the computer is that it makes it easy to err critically if we do not understand what we are doing. Running an analysis using a computer without any statistical knowledge can be really misleading. Hence this course could be called Unearthing the Statistician in You Using R.

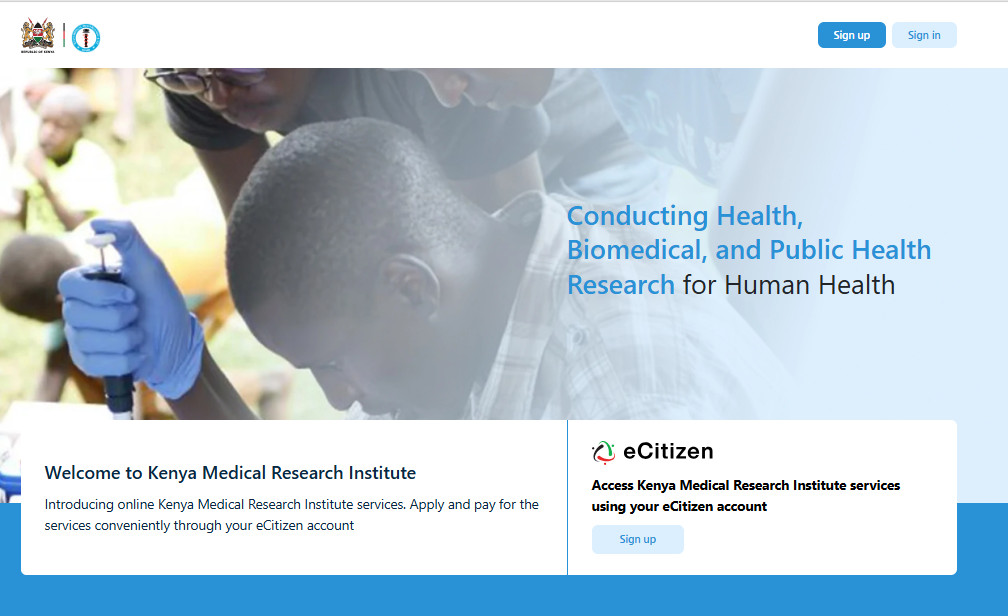
•Log in using your existing eCitizen credentials, or create a new account if you do not already have one.
•Click next to start filling in the online application form, in the list of courses, select “Data Analysis Bootcamp Using Open-Access Program R”.
• Once your application is submitted it will be reviewed and approved, upon approval you should receive an SMS notification with a link leading to the eCitizen platform.
• Login and go to History.
• Select the Application with the Stage highlighted as Pending Payment.
• Proceed to make payment.

Covers descriptive statistics, frequency tables, tests of independence, t-tests, non-parametric tests, and visualization of group differences.
Explores relationships between variables, regression modelling, interpretation of results, model diagnostics, assumptions, and prediction accuracy.
Focuses on analysing categorical outcomes, interpreting odds ratios, assessing model performance, testing assumptions, and predicting outcomes.
Covers comparing means across groups, testing statistical significance, conducting post-hoc comparisons, calculating effect sizes, and interpreting results.
Examines differences between groups while controlling for covariates, including model fitting, assumption testing, interpretation, and reporting of results.
Explores the effects of multiple independent variables on outcomes, including interaction effects, contrasts, post-hoc analysis, and visualization.
Covers sample size estimation and statistical power calculations for proportions, ANOVA, chi-square tests, correlation, t-tests, and general linear models.
Applies the statistical techniques learned throughout the course to a practical research project, culminating in a group presentation and written report.


Kenya Medical Research Institute
P.O Box 54840, 00200
Mbagathi Road,
Off Raila Odinga Way
Nairobi, Kenya
Tel: (254) 0202722541/4,
0713112853/4
graduateschool@kemri.go.ke